

How do you precisely measure the relative position of two objects a mile below the oceans surface? This was exactly the question I received from the Ocean Networks Canada (ONC) team.
Let’s go over some background. The geophysical team from ONC needed to replace their FETCH seabed monitoring platforms from a 10 year running continental drift experiment. To have continuity in their data the new sensor’s position relative to the old needed to be known to within centimeters. Quite the challenge 2000m below the sea surface with a lumbering ROV. There were 3 sites total we needed to localize.
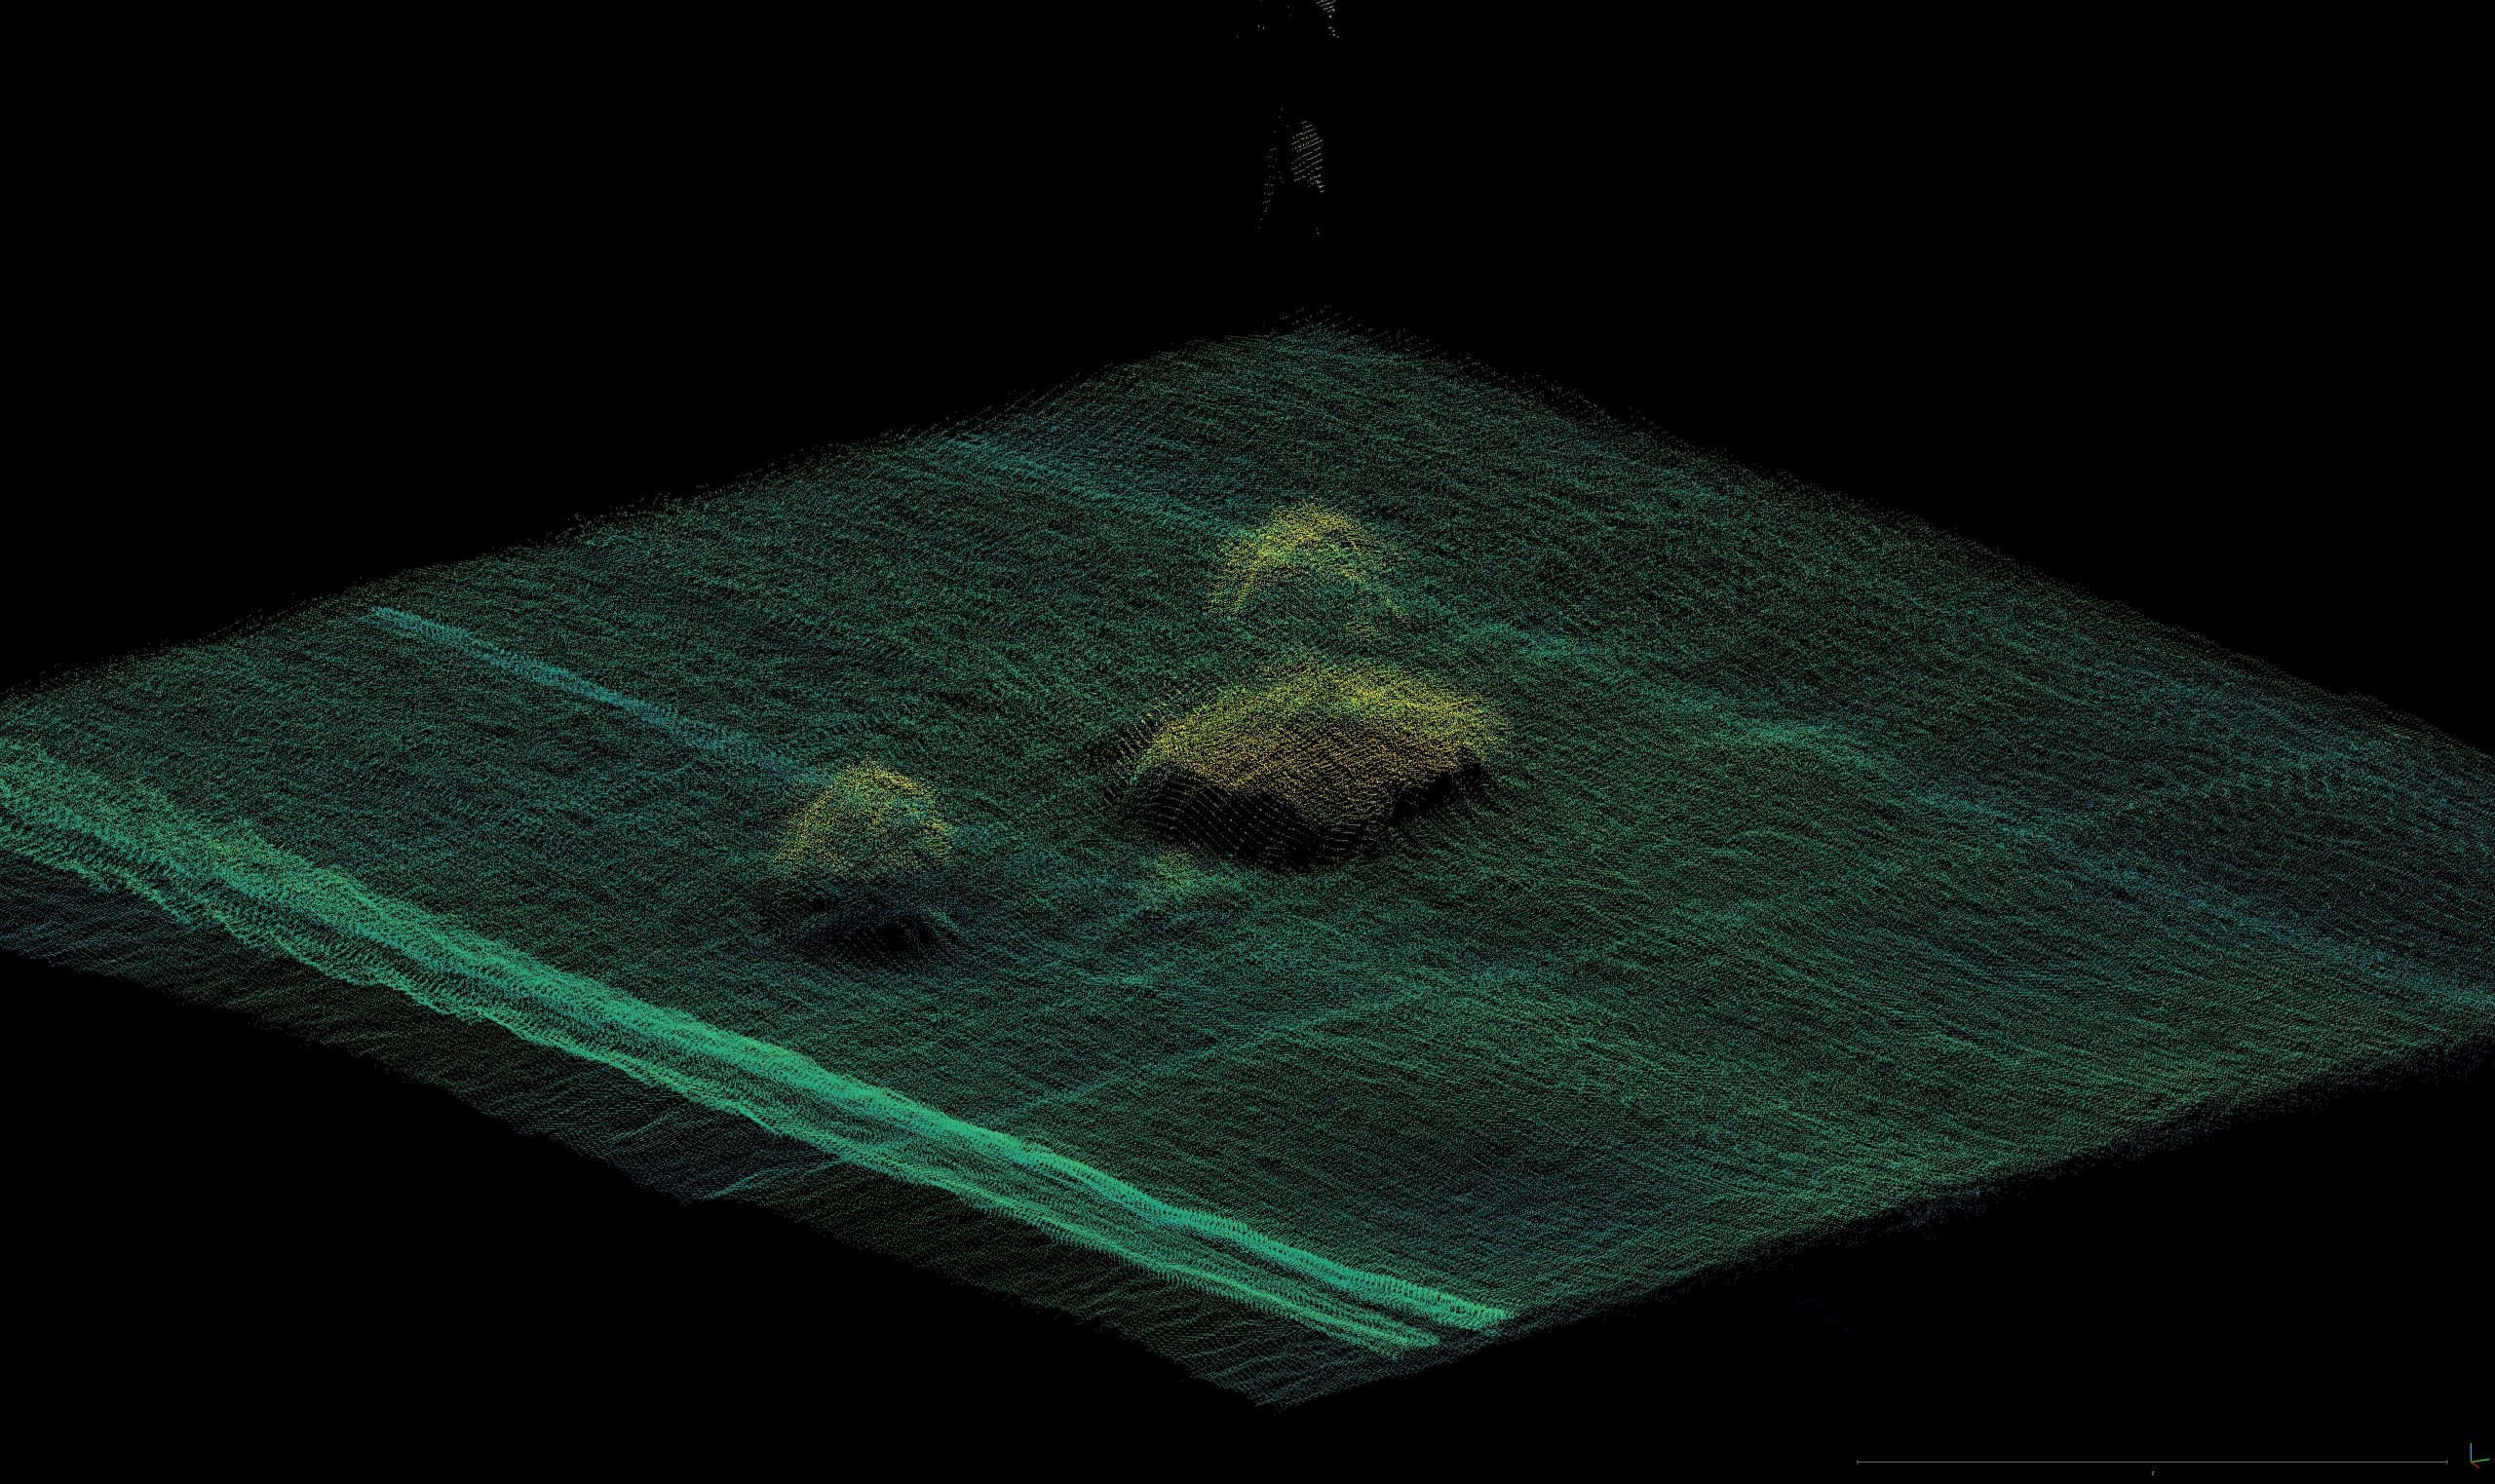
My first thought was to just map it. We had the sonar and mapping system online from the last cruise. The mapping system is good (it will give us about 5-10), but not quite good enough (we need <5cm). Acoustic mapping also isn’t great at detecting things in the water column.
We could use the main camera on the ROV to perform structure from motion (SFM) photogrametry. SFM produces a result with more precision (i.e. more detail and self consistent) but has poor overall scale accuracy.
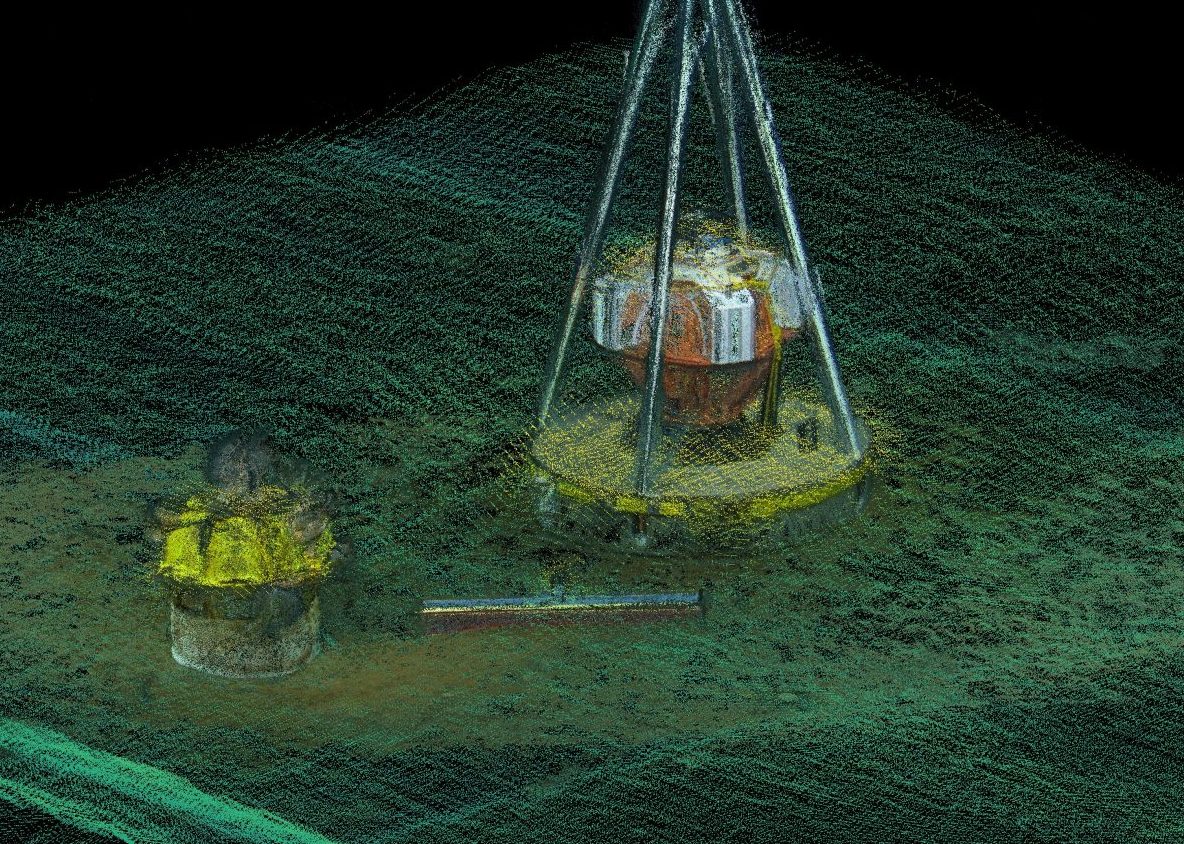
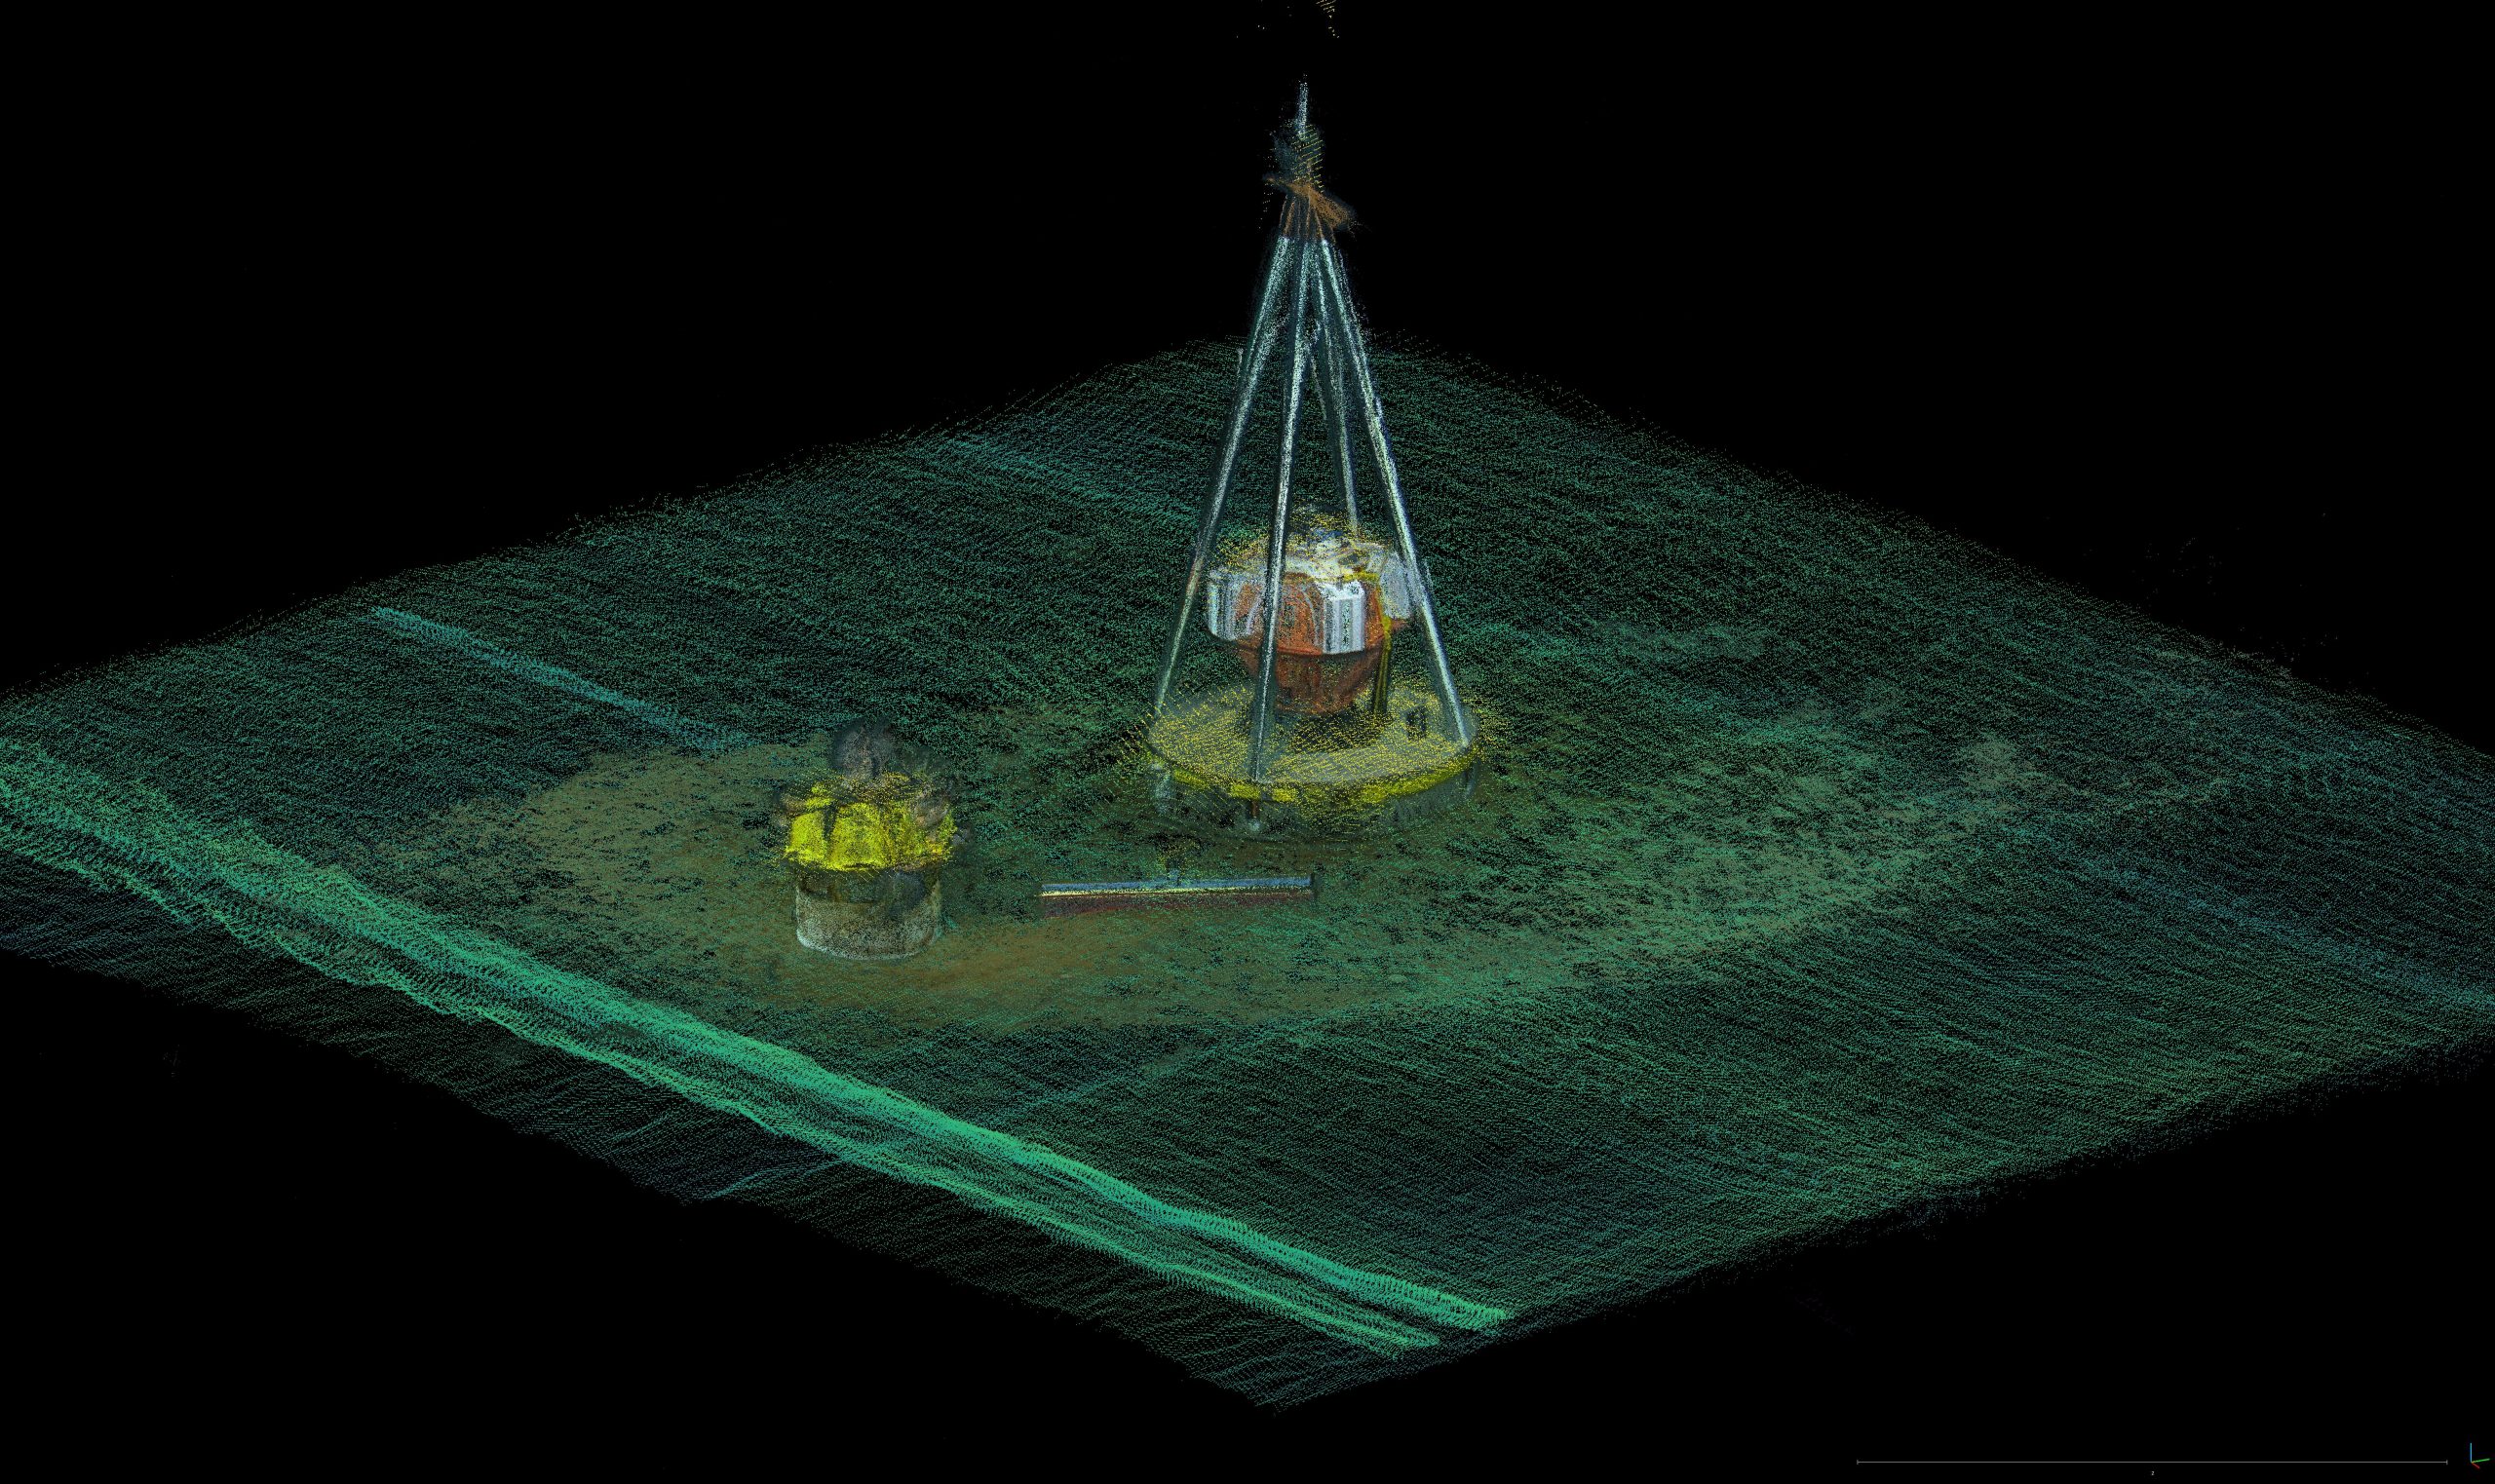
Ultimately, it was decided to use a hybrid method. We fist collected acoustic mapping data with the onboard mapping system. Later, a video dateset moving around the site was collected and used to create a SFM model. Finally a physical scale bar was placed on the seafloor that could be seen in both the acoustic data and the SFM data.
The SFM model was aligned to the acoustic map using ICP. Not only did this assign proper scaling to the SFM model but it aligned to to the geographic coordinate system. The scale bar was measured in the model and was found to be within 3% of it’s actual length. With that sanity check we could take all needed measurements from the SFM model and were able to get the required measurements to less than 5cm for all 3 sites.
No responses yet